ASk A Researcher
October 2013
North Dakota KIDS COUNT - why it counts for you
Karen Olson, program director for North Dakota KIDS COUNT
 Compass researcher Karen Olson is also the program director for North Dakota KIDS COUNT. She offers some insight into the KIDS COUNT program and how it can help ND Compass users – and vice versa.
Q: What is North Dakota KIDS COUNT?
North Dakota KIDS COUNT (NDKC), funded by the Annie E. Casey Foundation, provides data on multiple measures of child well-being and is a resource to help create, implement, and encourage good policy and effective services to better the lives of North Dakota children. We want to provide conversation starters for policymakers, families at the dinner table, and colleagues at the workplace. We hope you will use the data to tell the story of your community and bring about positive change.
Q: What is the Annie E. Casey Foundation?
The Annie E. Casey Foundation is a private charitable organization, dedicated to helping build better futures for disadvantaged children in the United States. It was established in 1948 by Jim Casey, one of the founders of UPS, and his siblings, who named the Foundation in honor of their mother.
KIDS COUNT, a project of the Annie E. Casey Foundation, is a national and state-by-state effort to track the well-being of children in the United States. By providing high-quality data and trend analysis, KIDS COUNT seeks to enrich local, state and national discussions concerning ways to secure better futures for all children — and to raise the visibility of children's issues through a nonpartisan, evidence-based lens. The Foundation also funds a nationwide network of state-level KIDS COUNT projects that provide a more detailed, community-by-community picture of the condition of children. KIDS COUNT state organizations improve programs and policies for children and families by collecting and reporting credible data and promoting the use of data-based advocacy and communications strategies. NDKC is one of these projects.
Q: What is the KIDS COUNT Data Center website and how do I find information on it?
The KIDS COUNT Data Center, an online social indicators site, provides access to hundreds of indicators on child well-being, grouped within the topics of demographics, family & community, education, health, economic well-being, and safety & risky behavior. You can download data and create reports and graphics that support smart decisions about children and families. In July 2013, the site was redesigned to make access to the data even easier. Simply go to http://datacenter.kidscount.org/. From here, you can search for data in a couple of ways, by “State” or by “Data Topic.” For example, users can click on “ND” on the map. Then, on the left hand side of the page, you can preview data by selecting county and congressional district as well as state. Below that, you can further refine the results by selecting data topics. Finally, next to the actual indicators listed below each data topic, data are marked with either an orange circle (county-specific, uploaded by NDKC) or a blue triangle (available by state, uploaded by National KIDS COUNT).
The indicators provided by National KIDS COUNT (shown with a blue triangle) come from national resources and allow for comparisons across states and, in some instances, congressional districts and the 50 largest U.S. cities. Data provided by the state KIDS COUNT organizations (shown with an orange circle) are obtained from national, state, and local resources, making comparisons within states possible (counties, etc.). If you run across an instance where an indicator appears to be listed twice, keep in mind that the data come from these two different sources, so the numbers may be different.
Q: How do you collect the data and when do new data come out?
Indicators provided by National KIDS COUNT are made available throughout the year, as they collect and process the information. NDKC collects county-specific data from various state and federal agencies in early spring (e.g., North Dakota Department of Health, North Dakota Supreme Court, and U.S. Census Bureau). Once the data are collected and the various indicators have been calculated, the numbers are prepared for presentation in our annual Fact Book which is released late summer, early fall; the 2013 Fact Book is now available. The Fact Book consists of 3-page profiles of child well-being data for the state, each county, and each planning region in the state (using the most current data available at the time). The same data are also prepared and loaded into the KIDS COUNT Data Center website (and are marked with an orange circle, as explained above) which allows comparisons over time.
Q: How can the planning regions and counties in North Dakota use NDKC data?
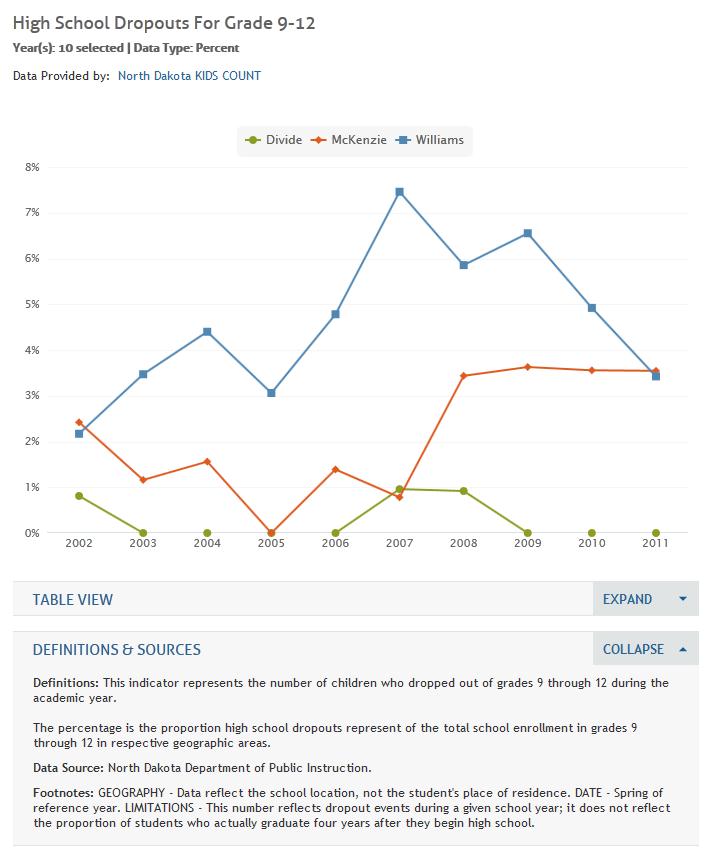
Community leaders, policy makers, nonprofits, journalists, and any interested person or organization can use the data from KIDS COUNT to provide context to situations. For example, we have been hearing that teens are dropping out of school at a much higher rate in the northwestern corner of the state because of high-paying jobs in the oil field. A quick check of the Data Center shows the rate of dropouts in three western ND counties (i.e., Planning Region 1). The rate was increasing in Williams County throughout the early 2000s, reaching a peak in 2007, and then has been steadily going back down (see graph below). In McKenzie County, the rate rose in 2008 and has seen little change over the past few years. Using the Map tab, you can quickly see where the highest dropout rates are for the state, and how the distribution has changed over time.
In addition to context, KIDS COUNT data can help identify a particular target population, such as uninsured children who may be eligible for certain health coverage programs for low and moderate income families. Current data suggest that the majority of uninsured children in North Dakota (60%) live in families with incomes that would make them eligible for Medicaid, Healthy Steps, or Caring for Children.
The data also promote discussion on topics that are important to families, businesses, and economic development. A recent example is the issue of child care in North Dakota. Using KIDS COUNT data, users are able to identify, by county, the proportion of child care need being met by child care providers. North Dakota KIDS COUNT provides information on the number of children living in families in which all parents living in the household are in the labor force – a relatively good proxy for the potential demand for child care. Currently, North Dakota licensed child care providers have the capacity to meet the needs of less than half of children who need it (39% in 2011). We also offer these data for the eight state planning regions in printable three-page profiles, available on our NDKC website, http://www.ndkidscount.org/data.php.
Overall, it is our hope that the information provided by NDKC will inspire action to improve the lives of children and families in our state.
Q: How does the information provided by NDKC differ from the information in the Early Childhood and Children & Youth topic areas on the ND Compass website?
I think a better question is: how do they complement each other, and how do they work together to help users understand child well-being in our state? For example, one of the key measures to understanding both a mother's health and nutritional status, and her baby's chances for growth, overall development, and long-term health is the low birth weight indicator. Mothers who do not receive prenatal care are three times more likely to give birth to a low-weight baby (and their baby is five times more likely to die). While ND KIDS COUNT offers the overall rate by state, county, and planning region, ND Compass offers users the opportunity to explore this measure by other geographies (by metropolitan status in this case) – and by race of mother and whether the birth was single or multiple. Users can also learn more about these associated indicators by clicking on “More Measures”, “Ideas at Work”, and “Library” found on the left side of the page. Under “More Measures”, users find a link to the KIDS COUNT Data Center under “Child Development and Well-Being” (among many other useful resources!). By visiting the KIDS COUNT Data Center, you can see many other interrelated indicators, including how many mothers are receiving inadequate prenatal care, the number of infant deaths occurring in a particular area, and the number of children who do not have health insurance coverage.
Data users are also able to compare multiple sources of data on one topic to gain a better understanding about an issue. For example, ND Compass provides information on child poverty from the Small Area Income & Poverty Estimates (SAIPE) program. NDKC provides child poverty data from the American Community Survey (ACS). By using both datasets, users are able to get a much better sense of how many children are impoverished and as such are disproportionately exposed to factors that place them at a higher risk for a wide range of problems. By measuring these indicators over time, we can track trends— and determine if we are improving, staying the same, or getting worse. By measuring these kinds of data, we can:
- Learn where we are today
- Inspire action to improve the quality of life in the region
- Measure progress over time
North Dakota KIDS COUNT has been fortunate to be able to collaborate with ND Compass. The information provided by both organizations is important to understanding quality of life in North Dakota and I would encourage users to explore both extensively!
The collaboration between ND KIDS COUNT and ND Compass is the subject of this short video by NDSU student Gregor Horvath.
Center for Social Research
North Dakota State University
Compass created by:
Wilder Research
© 2024. All rights reserved.